 |
||||||
 |
||||||
 |
||||||
 |
| [uk_rpi] [ILG_market_setting] [gilts_MV_since_2004] |
|
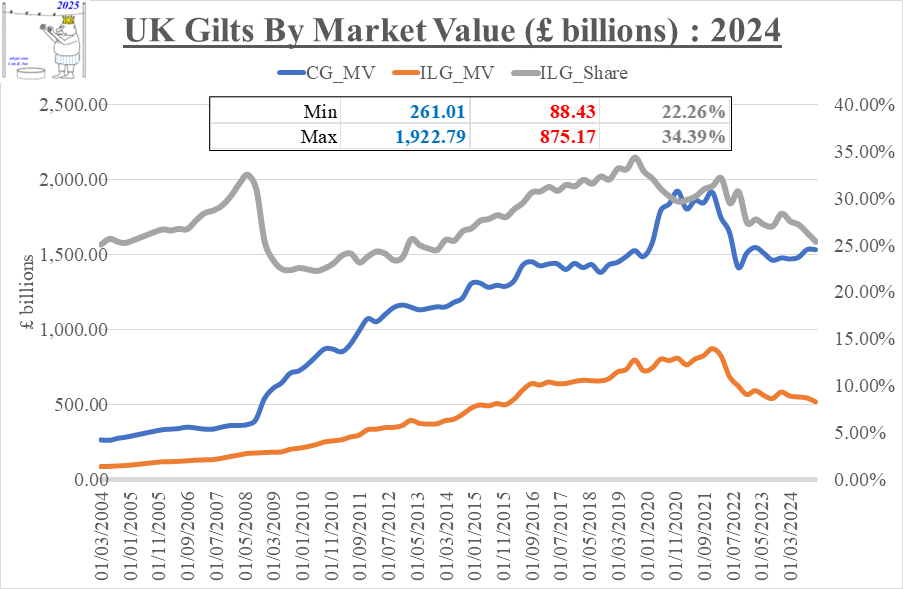
The chart below is based upon quarterly readings between the end of March 2004 and December 2024. The proportion of the total represented by ILGs (grey line) is tied to the right-hand axis. |
 |